U.S. Gas Production Still Rolling
28 June 2019
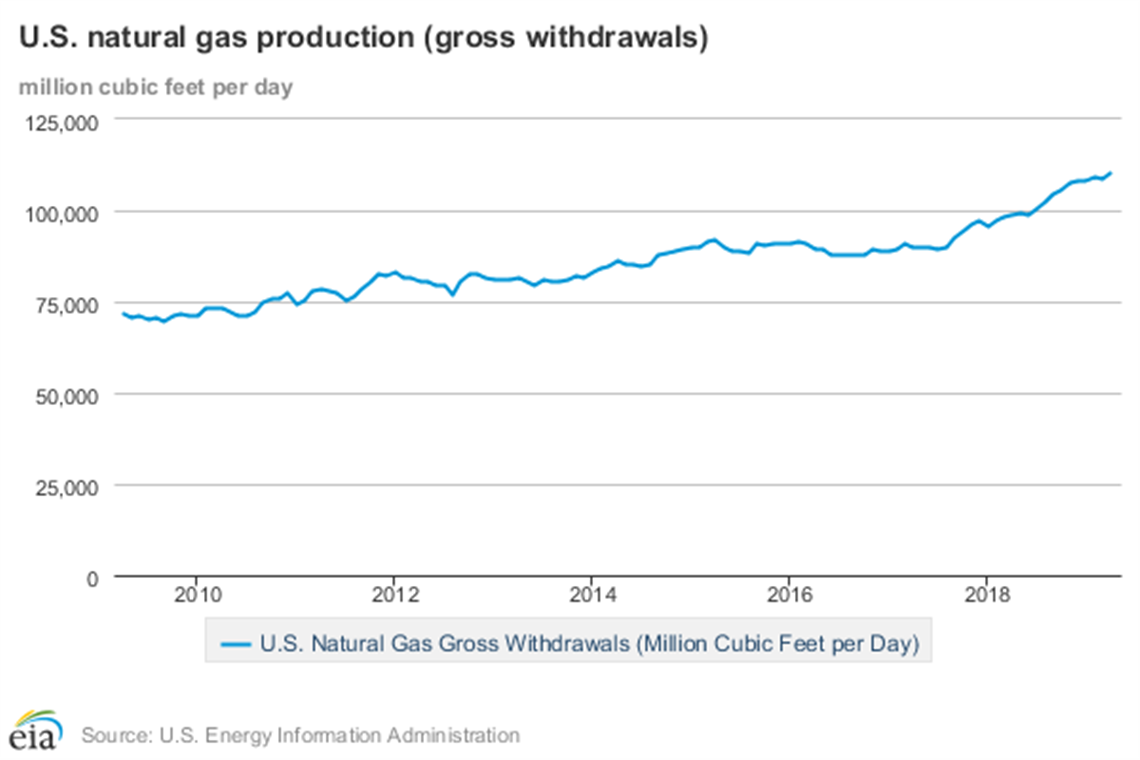
For all the financial, regulatory, political and legal issues that have beset the U.S. natural gas industry over the last months, it’s not seeming to have much effect on natural gas production according to the latest information from the U.S. Energy Information Administration (EIA).
In April, for the 24th consecutive month, dry natural gas production increased year to year for the month. The preliminary level for dry natural gas production in April 2019 was 2708 billion cubic feet (Bcf) or 90.3 Bcf/d. This level was 9.8 Bcf/d (12.2%) higher than the April 2018 level of 80.4 Bcf/d. The average daily rate of dry natural gas production for April was the highest for any month since EIA began tracking monthly dry natural gas production in 1973.
While production remained at record levels, natural gas consumption has shown a bit of a dip, the EIA report noted. The estimated gas consumption level in April was 2183 Bcf, or 72.8 Bcf/d — approximately 5.1 Bcf/d (6.5%) lower than the 77.9 Bcf/d consumed in April of the previous year.
April 2019 was only the second month since October 2017 that saw a year-to-year decrease in natural gas consumption. Still, consumption for April was the second-highest level for the month since 2001, when EIA began using the current definitions for consuming sectors.
Year-over-year, total consumption of dry natural gas in April decreased in three of the four consuming sectors. Deliveries of natural gas by consuming sector in April 2019 were:
– Residential — 327 Bcf, or 10.9 Bcf/d, down 25.5% compared with 14.6 Bcf/d last April.
– Commercial — 246 Bcf, or 8.2 Bcf/d, down 17.7% compared with 10.0 Bcf/d in April 2018.
– Industrial — 667 Bcf, or 22.2 Bcf/d, which was down 2.9% compared with 22.9 Bcf/d during the same period in 2018. Again, despite the decrease, industrial deliveries were the second highest for the month since EIA began using the current definitions for consuming sectors in 2001.
– Electric power — 724 Bcf, or 24.1 Bcf/d, which was up 2.4% compared with 23.6 Bcf/d in April 2018. Electric power deliveries were the highest for the month since EIA began using the current definitions for consuming sectors in 2001.
Net natural gas imports (imports minus exports) were down 130 Bcf, at 4.3 Bcf/d, in April 2019, making the United States a net exporter. Total imports were 6.9 Bcf/d, a decrease of 14.5% compared with 8.1 Bcf/d in April 2018. Total exports were 11.2 Bcf/d, an increase of 20.4% compared with 9.3 Bcf/d in April 2018. Natural gas exports were the highest for the month since EIA began tracking monthly exports in 1973.
The increase in exports continues to be driven by liquefied natural gas (LNG). LNG exports in April 2019 were 47.7% higher than in April 2018. In April 2019, the United States exported 4.2 Bcf/d of LNG to 22 countries. The average daily rate of LNG exports was the highest for any month since EIA began tracking them in 1997.
STAY CONNECTED

Receive the information you need when you need it through our world-leading magazines, newsletters and daily briefings.
POWER SOURCING GUIDE
The trusted reference and buyer’s guide for 83 years
The original “desktop search engine,” guiding nearly 10,000 users in more than 90 countries it is the primary reference for specifications and details on all the components that go into engine systems.
Visit Now
CONNECT WITH THE TEAM