Gas Processing Capacity Up Despite Fewer Plants
08 March 2019
Even as the number of gas processing plants in the continental U.S. declined from 2014 to 2017, total gas processing capacity and throughput increased by about 5%, according to the U.S. Energy Information Administration (EIA). Natural gas processing plant utilization rates stayed constant at 66% from 2014 to 2017, but several states experienced significant changes, largely reflecting changes in natural gas production across regions, the agency reported.
EIA’s triennial Natural Gas Processing Plant Survey tracks the country’s population of natural gas plants. EIA recently published 2017 data and an accompanying analysis that provide state-level summaries of total capacity, throughput, heat content and utilization of all processing plants in the Lower 48 states. The agency’s analysis also compares this data with 2014 levels, the last time the survey data were collected.
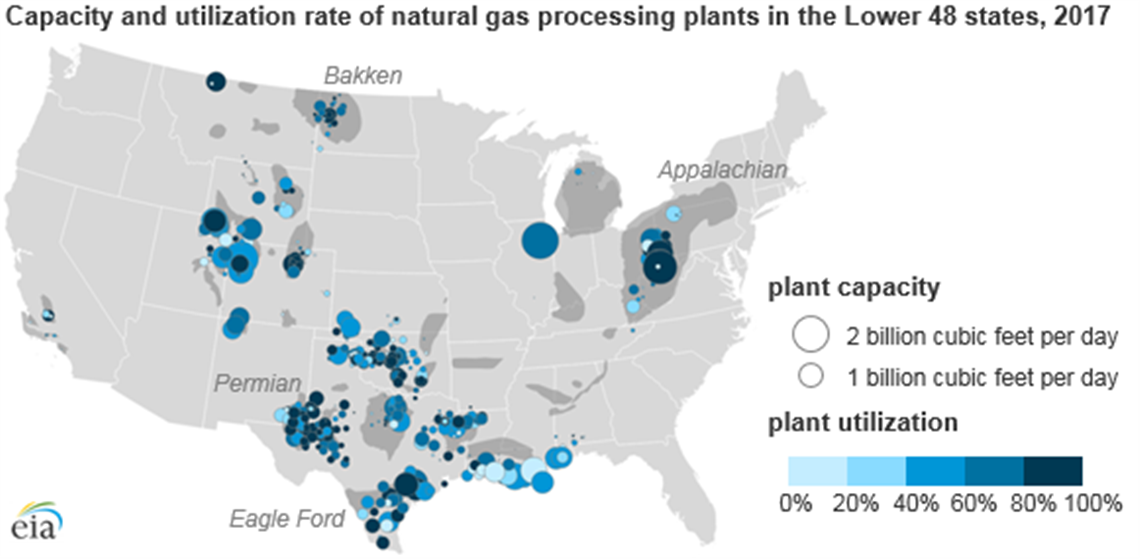
As of the end of 2017, 510 natural gas processing plants were active in the Lower 48 states with a total processing capacity of 80.8 Bcfd (2.3 X 10⁹ m3/d). On average, these plants processed about 53.3 Bcfd (1.5 X 10⁹ m3/d), operating at about 66% of capacity. Plants operate at less than full capacity for many reasons, the agency said, including transportation constraints, varying production volumes and characteristics and regional economics.
Regions with increased natural gas production, such as Texas (Permian, Eagle Ford), West Virginia (Marcellus, Utica), and North Dakota (Bakken), showed the largest increase in natural gas processing capacity and throughput between 2014 and 2017. In West Virginia, increases in the utilization of existing plants led to an increase in throughput from 2014 to 2017 that exceeded its increase in processing capacity, the agency said.
 At the national level, utilization rates remained essentially flat between 2014 and 2017, although some states showed more significant changes. In the Bakken region—Montana and North Dakota—both utilization rates and capacity increased, alongside increases in natural gas production. Similarly, Ohio and West Virginia, in the Appalachian Basin in the Northeast, also showed large increases in capacity and utilization.
However, in states such as Texas and Oklahoma, processing capacity grew more than throughput, resulting in slightly lower utilization in those states. Texas’s lower utilization rate may be partly attributed to the state’s natural gas production decline between 2014 and 2017.
For complete results of the EIA survey, click here.
STAY CONNECTED

Receive the information you need when you need it through our world-leading magazines, newsletters and daily briefings.
POWER SOURCING GUIDE
The trusted reference and buyer’s guide for 83 years
The original “desktop search engine,” guiding nearly 10,000 users in more than 90 countries it is the primary reference for specifications and details on all the components that go into engine systems.
Visit Now
CONNECT WITH THE TEAM